Alex Bordens
I'm a visual journalist, editor and data nerd living in Chicago. I'm passionate about telling stories through data visualization, GIS, engaging design and statistics. I graduated from Ball State University and completed a certificate in Geographic Information Systems at DePaul University. When not hacking on news stories, I enjoy making homemade sausage, French cooking and collecting rare whiskey.
Follow @alexbordensdata visualization + information graphics
responsive design + digital storytelling


data analysis + reporting
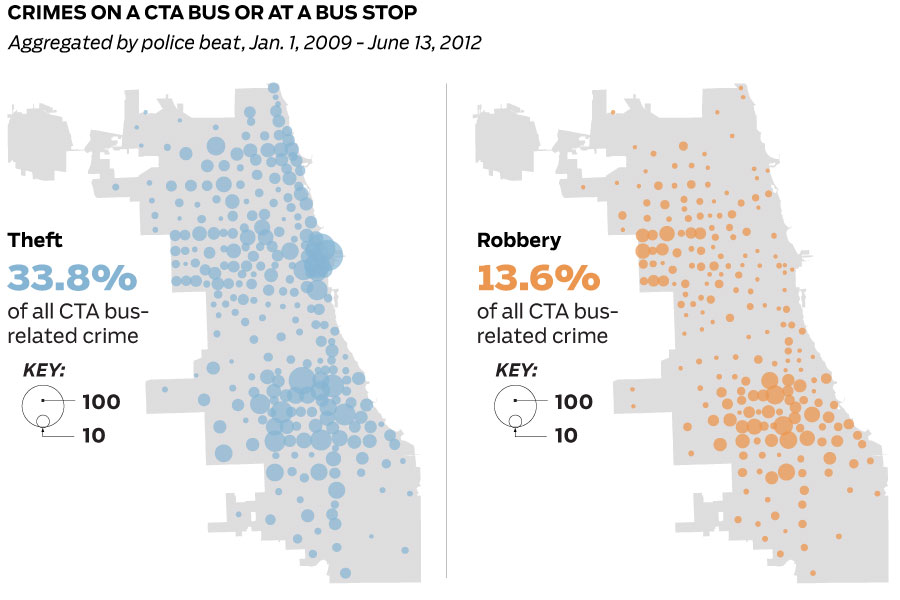
CTA crime
Analyzing 11 years of Chicago Police Department crime data revealed a growing trend of thefts and robberies on CTA buses and trains fueled by a sharp increase in the theft of electronic devices, such as iPhones. The analysis using per capita rates, GIS and data visualization showed the risk to CTA riders, crime patterns and causes. The two part series informed readers of risks, time of day and geographic trends while telling the story of numerous crime victims on the CTA.
Read part one
Read part two
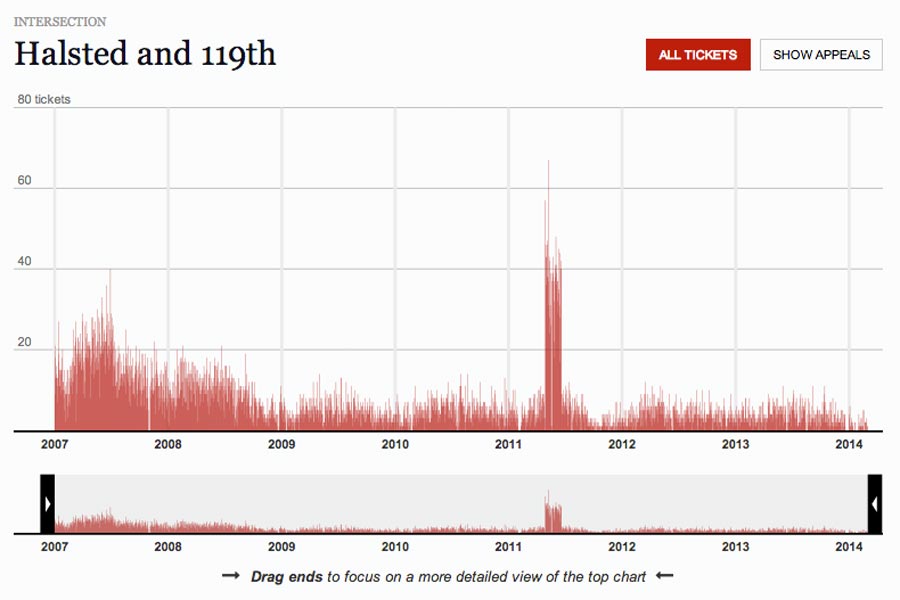
Red light cameras
When Mayor Rahm Emanuel accused the Tribune of ignoring safety statistics and challenged the paper to analyze the report, we did exactly that. The results of our analysis of city traffic data using GIS revealed a far less dramatic conclusion than the city claimed, which mirrored national trends. The story detailing the results appeared on page 1 as part of a large investigation into the city's red light camera program and won an award for political and government reporting from the Chicago Headliner's Club.
Read the story
Divvy bike share accessibility
Chicago is known as a diverse yet racially clustered city. When Divvy released the locations of Chicago's new bike share system it was easy to eyeball a map and infer that the system favored white neighborhoods. However, a deeper analysis using GIS and U.S. census data found that the network was concentrated in the city's most densely populated areas, which are also home to mainly white residents. The analysis led to a story examining the program's launch strategy and a web graphic examining bike share systems in Chicago and other major U.S. cities.